Blow Up Installation
Information visualization of the Twitter activity at Push Conference 2014.
This is where the video goes.
»Blow Up« is an experimental installation we programmed and built within four days for the Push Conference. It visualized the Twitter activity at the Push Conference by using balloons and projections.
For this purpose, Twitter was permanently scanned for the hashtag #push14 as well as the names of the conference speakers. When one of the speakers' names was mentioned, the respective balloon was inflated a little and the Tweet was projected on the balloon. This playful way and the unusual, direct feedback created a kind of »race«. The audience was excited to see which balloon of the leading six speakers would burst with a loud bang next.
Which balloon will burst first?
The hardware of »Blow Up« consists of a computer, a compressor, many hoses and a solenoid valve island that is addressed via an IO box via Relais directly from vvvv. The tweets are captured and analyzed by Processing and Twitter Streaming API and then passed on to vvvv.
Post-conference we re-created the installation digitally. With P5.js - a Javascript port of Processing - we created a visualization of all collected data. For this we used REST Twitter API, which allows to retrieve tweets of the past days on specific topics, hashtags and usernames. The resulting JSON dataset was visualized using P5.js and JQuery.
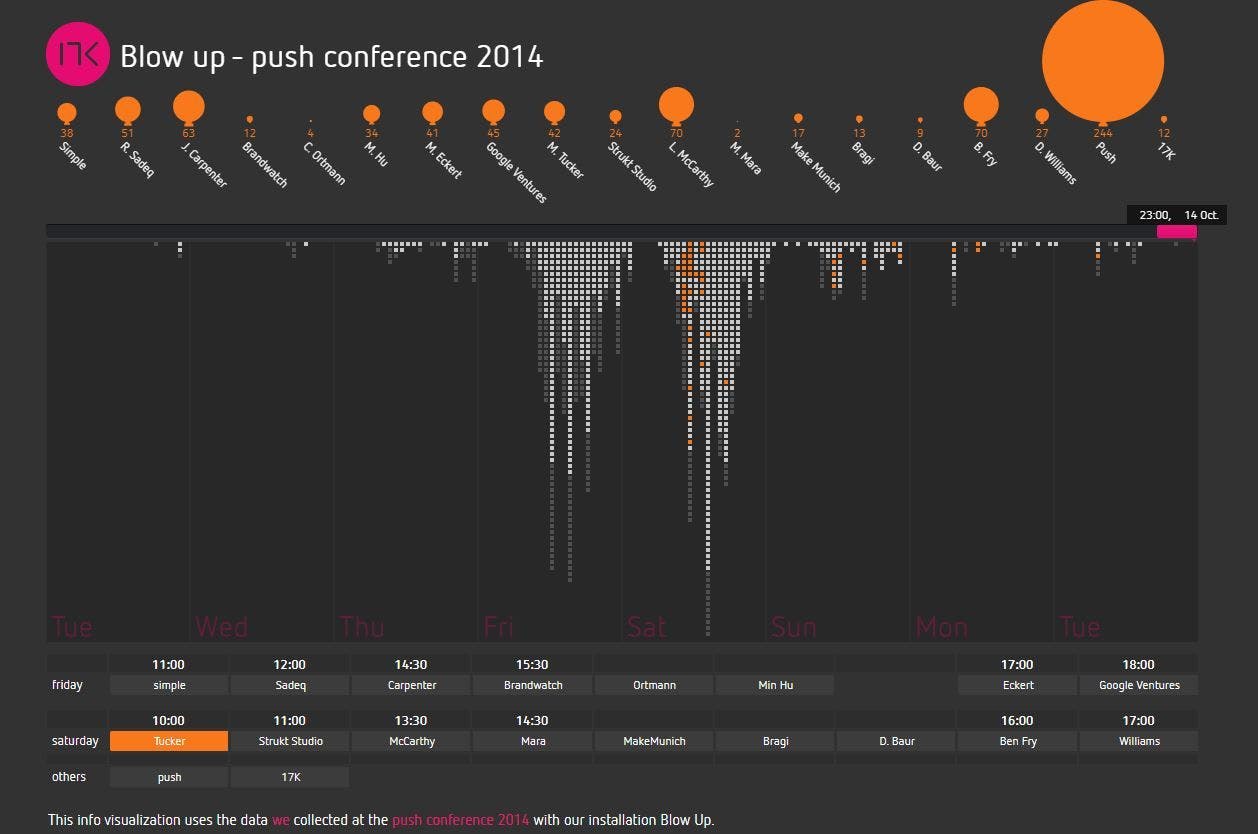
To evaluate the activities and developments on Twitter during the conference, we chose a one-week period around the Push Conference and put all tweets with the hashtag #push14 on a timeline. Mentions were represented in color. All tweets in which speakers were mentioned, were displayed in white, otherwise they remained gray. Using the scroll bar in the middle, the development can be tracked over time and you can watch the balloons become bigger.
The digital visualization can be tested at https://www.17k.de/blow-up-push-conference-2014/.